Ever wanted a SCADA interface for owfs?
Rob Conway's announcement (on owfs-developer's list)
As everyone on this list know’s we have the answer to low cost data collection,OWFS However there is a missing link which I believe has not been explored, creating some standardized display of data that people can use on their web servers. The owfs http interface is fantastic from a maintenance point of view however does little for someone wanting to publish the information via the web. Well after 2 years I think I have found the third piece to this puzzle. I have tried all sorts of techniques to get the data onto my web site however this is GREAT!.
Welcome Raphael.js
This small 100k javascript library enables you to create dynamic graphics (same as Scalable Vector Graphics) with no programming at all.
An example
 <!--Create Gauge Divs-->
    <div id="g1" class="gauge1"></div>

<!--Create Raphael papers and assign to Div ID's-->
<script language="javascript" type="text/javascript">
        paper1 = Raphael("g1", 155, 155);
Now once a canvas (paper) has been assigned you can draw directly onto it
This creates a circle at x, y, 6 px diameter etc etc
Paper1.circle(81, 98, 6).attr("fill", "silver").attr("stroke", "black");
This creates a line and I can rotate the line i.e. gauge pointer!
Paper1.path().moveTo(80, 100).lineTo(45, 110).rotate(rotation,81,100);
If you have not visited my site for a while and are interested in creating dials and gauges bar graphs etc take a look www.rjconway.homeip.net
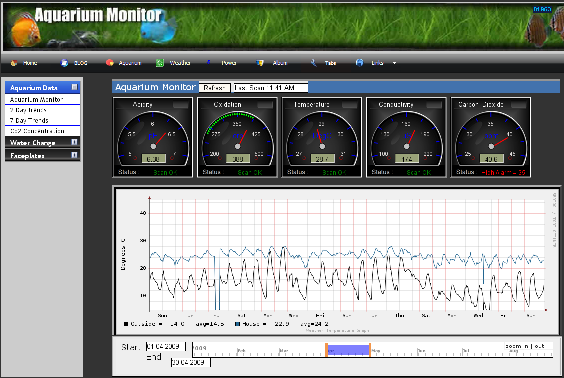
The gauge background is just an image however the scale graduation, pointer, LCD display provides a reusable widget that can display any data. I have documented the code so you should be able to see whats going on very easily.
I get a text file from server (Uses Ajax), Split the txt file into an array and then split again so you end up with an array of variables from the simple txt file.
You can see the txt file (better cut and paste the whole line) www.rjconway.homeip.net/aqua_tag.txt
Extract from code
Tag(x) array explodes the array[1] into the following:
        [0]Description
        [1]Engineering units
        [2]Value
        [3]Setpoint -NOT USED
        [4]HighScale
        [5]LowScale
        [6]HighAlarmValue
        [7]LowAlarmValue
        [8]Alarm Status, 0=Normal 1=High 2=Low  -NOT USED
        [9]Alarm Acknowledgement 0=Ack 1=UnAck  -NOT USED
        [10]Alarm Time   Epoch -NOT USED
        [11]Auto/manual, 0=Man 1=Auto -NOT USED
        [12]Scan status, 0=Bad 1=Good
        [13]Show alarm bands, 0=no bands, 1= Normal range, 2=Low alarm, 3=High alarm, 4=Both Low & High Alarm Bands
        [14] Max value last 24hrs (Will be used to show history) -NOT USED
        [15] Min value last 24hrs (Will be used to show History) -NOT USED
So I simply use the array data to drive the gauges. i.e. to get the value its just “Tag1[2]” . The gauge I created has a pointer movement of 212degree’s thus there is some calcs based upon the high and low range of the gauge to calculate the rotation required, I also calculate the numbers displayed on the graduations. The txt file is simply created with a bash script running every 90 seconds. You can simply change the low / high range in the txt file and the gauges will adjust, thus with a simple loop you can animate all the gauges. My text file contains 5 different tags.
I am happy to share any code, the gauges have simply been built in powerpoint and I have 4 different coloured gauges. I am working on a set of bar graph displays. I know the code looks simple now but it has taken me a lot of time to get it to the point of easily refreshing the data, being able to dynamically build trends on the fly. I can push on solo with this development or owfs group could look at how we could maybe create a more standard interface to get the data from the server to the client. Most of the data in the array is fixed or calculated via a bash script however a lot of it could also come from the 1wire device parameters.
Can you see the power of owfs, rrdtool and Raphael combined, nobody else has this solution for $0.00 ? checkout the Raphael.js web site for other demo types. We (owfs group) have a complete solution from data gathering, trending and now a rich graphic environment potential all without any real programming. If we standardized on a data array set (similar to above) “collectively” we could build graphic elements to be simply used within any web site. These graphic elements could be part of the owfs web site to be used by everybody. You could build a great weather station and not be locked into the interface someone else wants you to see.
I still have some work to do on the gauges, just gotta get the alarm bands auto drawn on the scale however thought I would share this as it stands now. You can now dynamically change the trend data in real time and redraw the data, this bit is really cool. I still have to link the gauges so when clicked they will call their respective history for the trend. The web site trend just shows the weather at the moment. If you wait 90 seconds and press refresh you can see the gauges update, I will eventually put the refresh on a timer. However no time this weekend so will finalise it next weekend however wanted to share progress with the group to see if I can get any interest in further development or potentially some standardization in data transfer.
rob
Previous page: Display Solutions
Next page: Advanced